

.svg)
Are you watching advanced manufacturing investment bypass your region for neighboring states with stronger talent pipelines? Or struggling to explain to your state's economic development office why critical technician roles stay vacant for months?
On a manufacturer's floor, you see the gap instantly. Open positions stay unfilled for months while production deadlines slip.
The gap you're feeling is real, but the way most regions measure it is wrong. Technician shortages exist. Yet pure head-count comparisons miss what actually determines whether a manufacturer picks your region. The question isn't just "Do we have technicians?" It's whether your region can fill specific roles, do it fast enough, and keep people in those jobs while paying competitive wages.
Manufacturing America is establishing the first benchmarking standard for regional manufacturing readiness. A manufacturing readiness score measures four dimensions that predict whether your region can attract advanced manufacturing investment and staffing. It turns invisible workforce gaps into measurable benchmarks. It lets you compare yourself to competing metros on the same scale. It shows where to invest first for maximum competitive gain.
Unmudl, the skills-to-jobs marketplace connecting job seekers with technician training, operates the infrastructure that regions and employers use to close their readiness gaps. But the scorecard methodology is free and open. Any state council or regional coalition can calculate and track it.
A manufacturing readiness score is a forward-looking composite measure of whether your region can meet a specific manufacturer's technician staffing needs in a realistic timeline. It's not a simple inventory ("we have 847 active maintenance technicians"). It's a multi-dimensional assessment of supply, training throughput, competitive wage position, and workforce stability.
Why does this matter to you? Manufacturers choosing locations make decisions based on workforce reliability, not wishful thinking. Site developers evaluating Michigan versus Georgia versus Texas ask identical questions. Can you field 60 qualified maintenance technicians within six months? Once I hire them, what's your typical turnover rate? Are there clear career paths, or do technicians leave the region after two years?
A manufacturing readiness scorecard turns those subjective questions into measurable data points. States and metros can calculate and publish annual scores. Over time, the scorecard becomes the standard language between regional leaders and manufacturers evaluating talent pipeline strength.
The framework isn't proprietary. Manufacturing America coordinates the methodology and supports state councils in calculating their scores. Any employer coalition or economic development agency can publish their own region's benchmark. Transparency drives regional competition, and competition drives improvement.
The first dimension measures the gap between currently available technicians and the open roles employers actually need to fill right now.
This sounds straightforward. Count technicians. Count open positions. Skills gap analysis requires that you calculate the gap with precision, using current data rather than assumptions. Most regions fail here anyway. They conflate technician supply with job-ready availability. Or they measure demand using outdated projections instead of asking employers directly what roles they need filled today.
A proper inventory-versus-demand assessment requires two things. First, a current count of job-ready technicians in your region. This means people with NCCER (National Center for Construction Education and Research) certification, ASE credentials, EPA 608 certification for HVAC work, or manufacturer-specific qualifications that employers recognize. Second, a current pipeline of open positions posted by manufacturers, utilities, and industrial employers actively hiring in your region.
The gap isn't always shortage. Some metros have more qualified technicians than near-term demand. But most advanced manufacturing regions face structural undersupply. BLS data confirms that skilled trades employment has grown faster than other sectors over the past decade. Regional scorecards make that trend visible at your doorstep.
Severity matters equally. A region with 100 unfilled roles but strong training infrastructure can close a gap within 18 months. A region with the same gap but no pathway to accelerate qualification may not resolve it until 2028. The readiness scorecard separates gap size from closure timeline, so regional leaders understand their actual constraint.
Training capacity is where the real bottleneck emerges for most regions, and it shifts fastest under intentional investment.
Your region might face a significant technician shortage. But if it takes two years to qualify a candidate through a traditional community college program, you can't absorb new employer demand quickly enough. A competing state that offers employer-designed accelerated training closes the same gap in months. That state wins the project. That employer invests there.
This dimension measures how many job-ready technicians your region can realistically qualify per year. It tracks the average time-to-qualification for each training pathway. Some pathways move fast. Employer-designed training programs can move people to job-readiness in weeks to a few months. Traditional two-year associate degrees take longer. Both pathways have value. The readiness scorecard separates them so regional leaders see which levers produce the fastest results.
Training capacity also reflects constraints. A community college can't enroll 500 HVAC students per year if it has one instructor and two lab bays. The readiness scorecard flags instructor availability, equipment, and facility bandwidth. Regions often discover that equipment or instructor limits are the binding constraint, not willingness to expand. Those constraints are fixable through targeted investment.
Employers pursuing speed already know this. Foundations of Automated Equipment Maintenance and Mechatronics and Robotics Maintenance compress qualification timelines from years to months. Understanding which accelerated options exist in your region, and which employers are already using, reshapes your readiness calculation.
A region with a solid median wage for maintenance technicians might seem competitive. But not if regional housing and cost of living run significantly higher than national averages. Wage competitiveness isn't absolute salary. It's purchasing power relative to local costs.
The third dimension measures whether your technician wages align with cost of living and housing affordability in your region. A technician in a lower-cost metro has stronger real purchasing power than one earning more in a high-cost coastal or urban region.
Employers know this math. Skilled technicians, especially those with mobile spouses or access to national job markets, make location decisions based on real wages. They care about what their paycheck buys them. If your region's wage-to-cost ratio trails competing metros significantly, you attract fewer candidates even if you have robust training. Talented people move elsewhere because their money doesn't stretch as far at home.
The readiness scorecard includes regional wage data from BLS and state labor agencies, aligned with local housing costs, tax burdens, and cost-of-living indices. A region that appears strong on raw wage can reveal competitiveness gaps when cost-adjusted. The reverse is also true. Some lower-wage regions have stronger real purchasing power than higher-wage competitors, especially in advanced manufacturing hubs with lower housing costs.
This dimension also tracks whether technician compensation keeps pace with cost-of-living increases. A region where technician wages lag inflation faces rising turnover even if absolute pay feels adequate. Workers sense their purchasing power eroding and shop for better markets.
The final dimension measures whether technicians who enter your region stay, advance, and build careers.
Turnover is expensive for manufacturers. A technician who leaves after 18 months costs the employer six months of lost productivity and thousands in replacement training and onboarding. Technicians who progress into senior roles, supervisory positions, or advanced specialties represent career stability. They stay longer, mentor new hires, and deepen roots in their region.
This dimension tracks retention rates by tenure (first year, first three years, five years) and role progression patterns. A manufacturing center with high first-year turnover but strong five-year retention has a different stability profile than one where experienced technicians consistently exit. The readiness scorecard separates these patterns so manufacturers understand where leaks occur in your talent pipeline.
Career progression matters deeply. Technicians with clear advancement routes (entry maintenance technician, senior technician, lead role, supervisory track) stay put. Regions that wall off career growth see technicians leave for other industries or relocate to larger metros with more opportunity. Frontline Leadership for Manufacturing and similar supervisor-track programs unlock the next rung for your workforce and retain your best people.
Regional stability also depends on industry diversification. A region dominated by a single employer or industry faces higher risk when that employer weakens or shifts production. Diversified regional manufacturing economies absorb shocks better. Technicians see broader career options within their own region and less incentive to leave.
Once you calculate your region's scorecard, the strategic question becomes: where do you invest first?
Improvement follows the weakest dimension:
The fastest wins usually come from training capacity. A region can partner with leading employers to design accelerated training programs that close a shortage gap within 12 months. Investment in instructor development, equipment, or facility capacity produces visible results quickly. It attracts employers who've already learned to invest in rapid upskilling.
Wage competitiveness takes longer to address but is tractable through housing policy, tax incentives, and coordinated employer wage agreements. Regions that struggle here often need to attract multiple employers simultaneously to create wage competition that lifts compensation for everyone.
Workforce stability demands sustained focus over years. Clear career pathways, tuition support, professional development programs, and mentorship all retain technicians over the long term. Employers and community colleges need aligned incentives to prioritize retention as seriously as hiring. Browse the training programs available in your region to see which support career advancement.
Regional competitiveness manufacturing isn't fixed. Regions that measure readiness systematically and invest strategically move up the rankings year over year. Regions that delay or ignore these dimensions fall behind their competitors.
Leading manufacturers using Amazon Career Choice through Unmudl's marketplace have already discovered the advantage of speed. They design training programs that move people from hire to job-readiness in weeks, not years. They don't wait for the perfect candidate. They invest in rapid upskilling and advancement.
Regions that embrace this velocity attract and retain that investment. Regions that cling to traditional two-year education cycles as their only option fall behind in competition. The manufacturing readiness scorecard makes this trade-off transparent. Regions optimized for fast time-to-qualification attract employers who've already learned to invest in training. Regions that move slower lose them.
Your region's competitive position is measurable right now, and it's changeable with focused investment. Start benchmarking your manufacturing readiness at Manufacturing America today.

CFOs and operations leaders reshoring U.S. production must assess workforce readiness before capital commits. Manufacturing America's due-diligence framework surfaces technician gaps, training capacity, and retention risk.

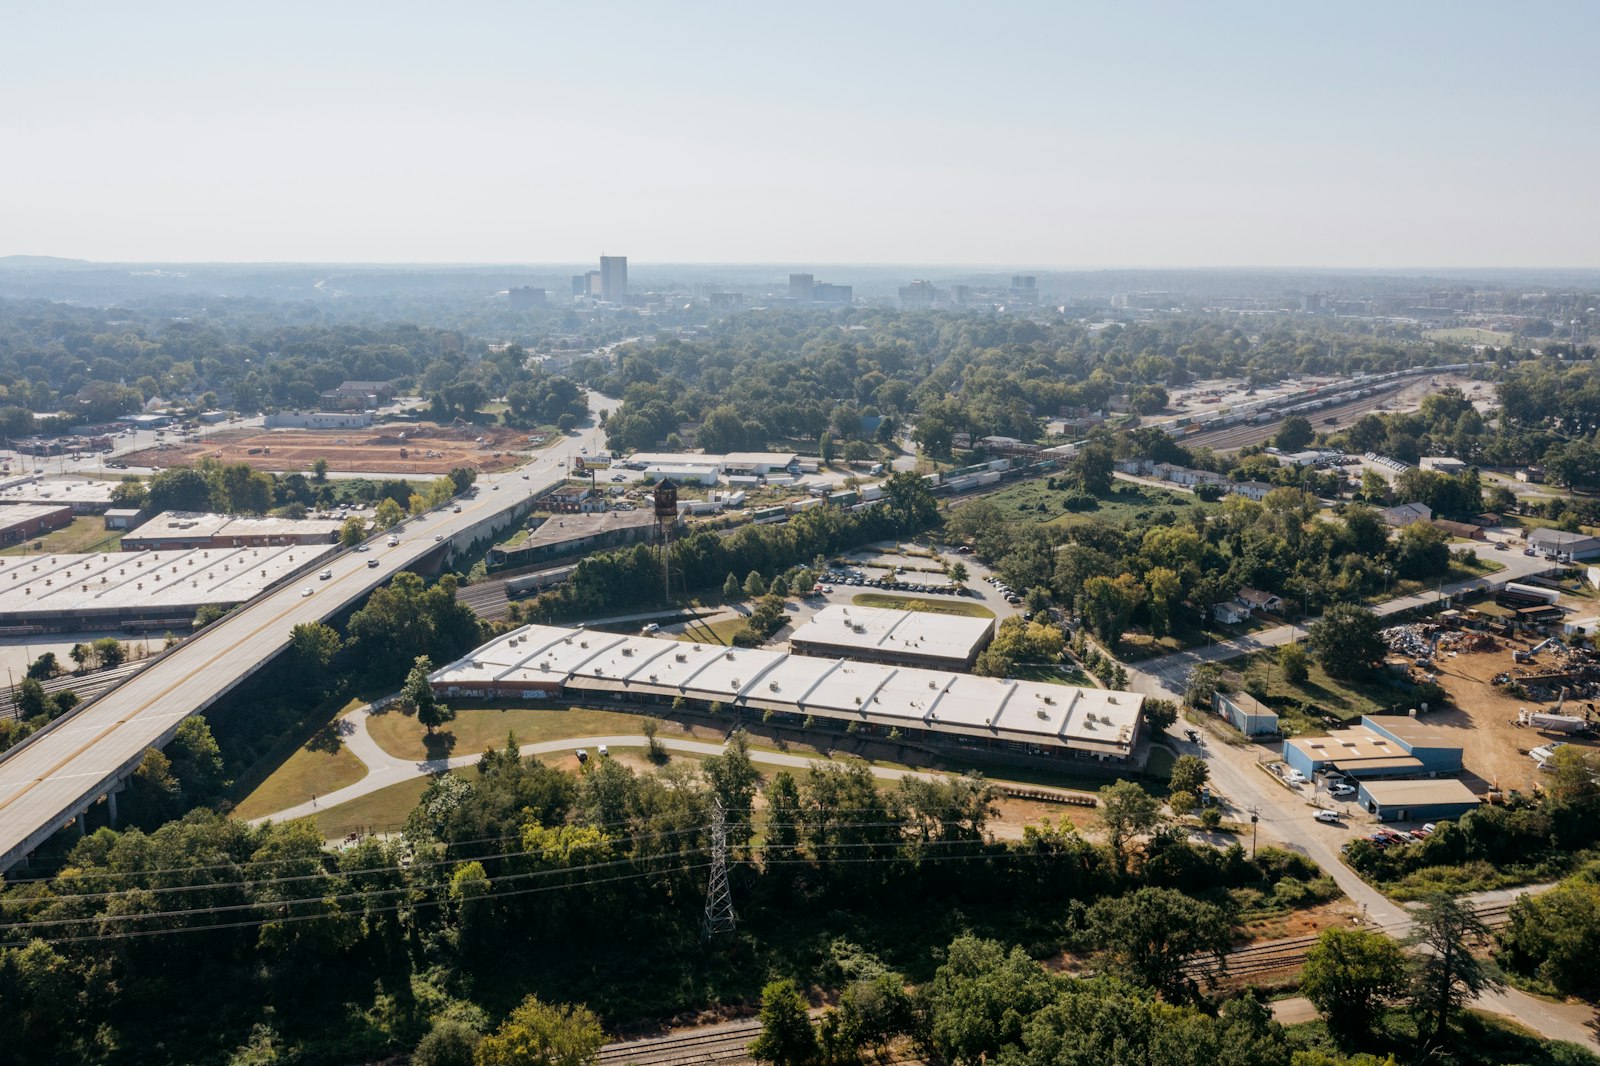
How manufacturing employer networks drive technician hires, cut hiring costs, and build competitive advantage. Explore the models reshaping American manufacturing regions in 2026.
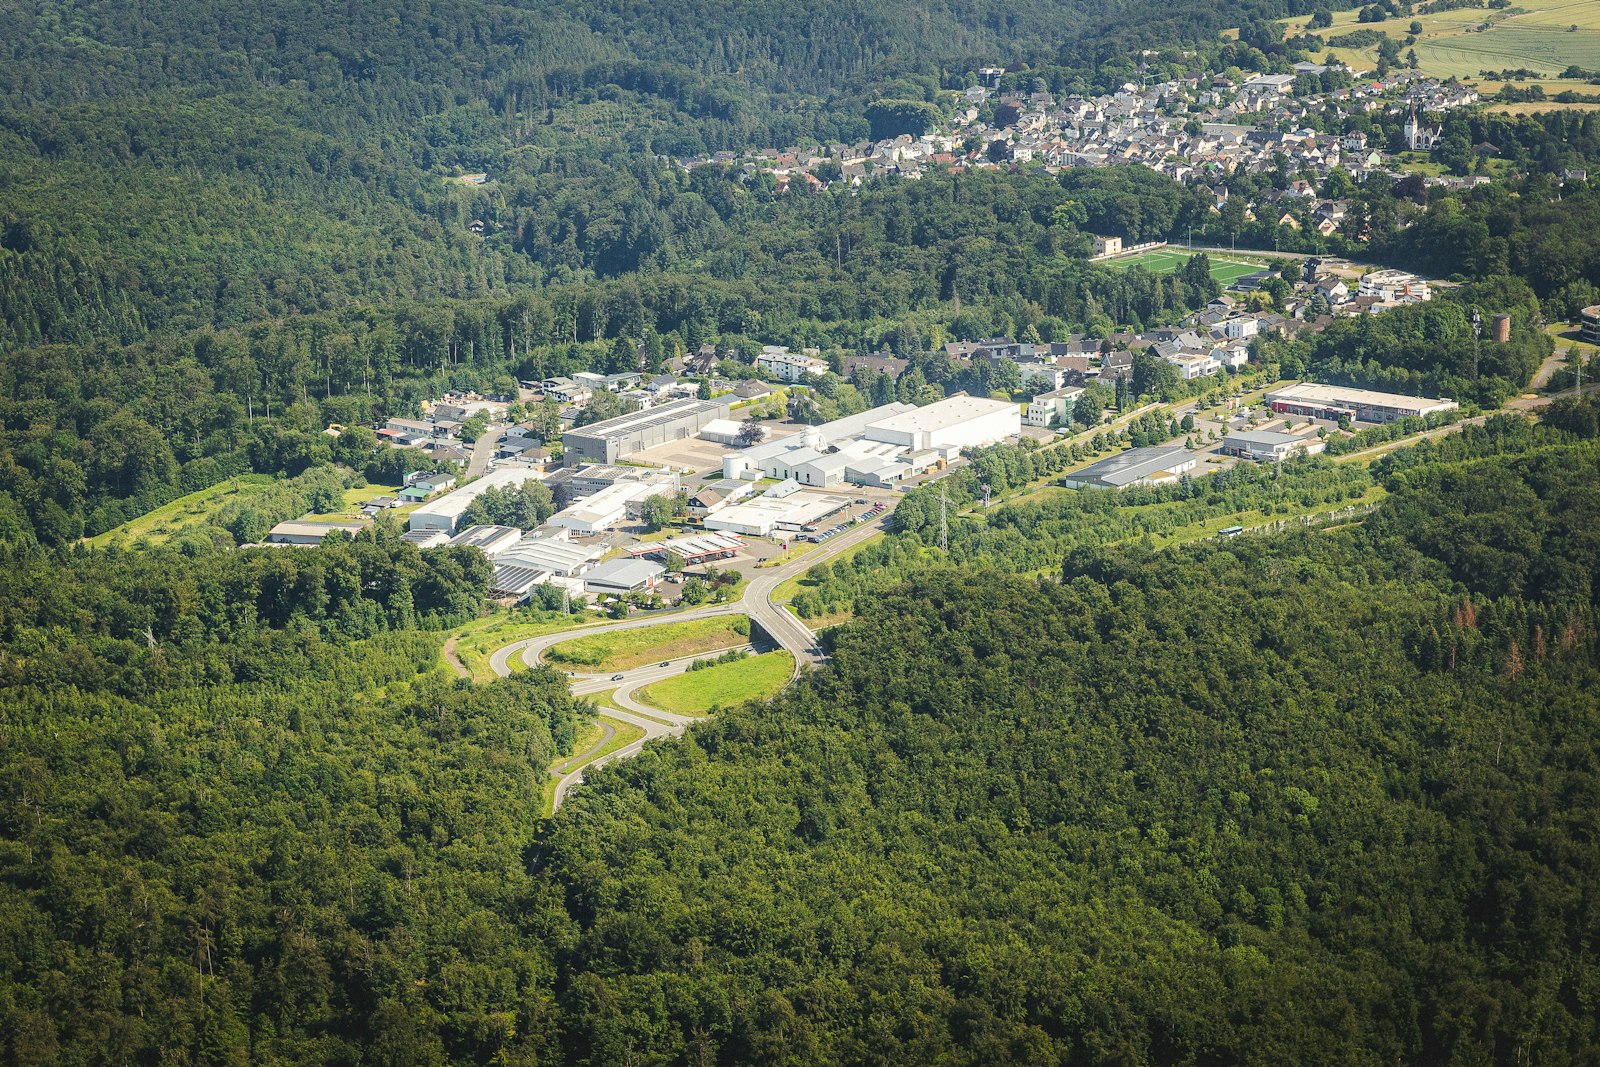
Discover how rural communities attract reshored manufacturing jobs through workforce development, incentives, and strategic partnerships with employers.


.svg)